Here we go! In this chapter, I’ll show you a chart without any drawings—and then one with drawings—so you can clearly understand how to identify support and resistance levels in Bitcoin.
Remember: Bitcoin always respects support and resistance.
First, take a look at the chart below with no drawings. It’s what I call a “nude chart” 😯😯
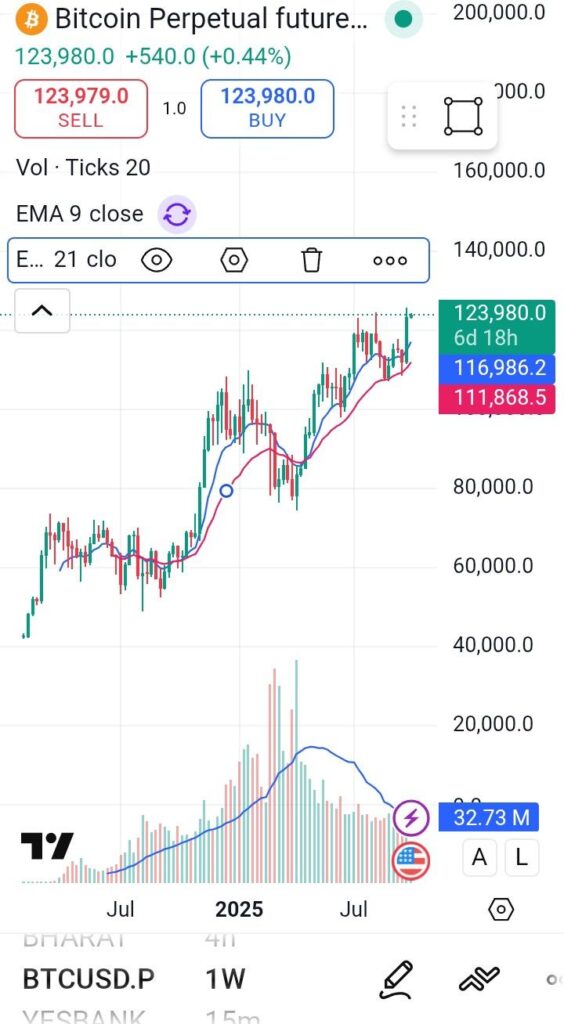
At this point, it’s hard to identify where the support and resistance zones are just by looking at the naked chart.
Now, check out the next chart where I’ve simply drawn two lines. Instantly, you’ll be able to recognize the support and resistance areas.
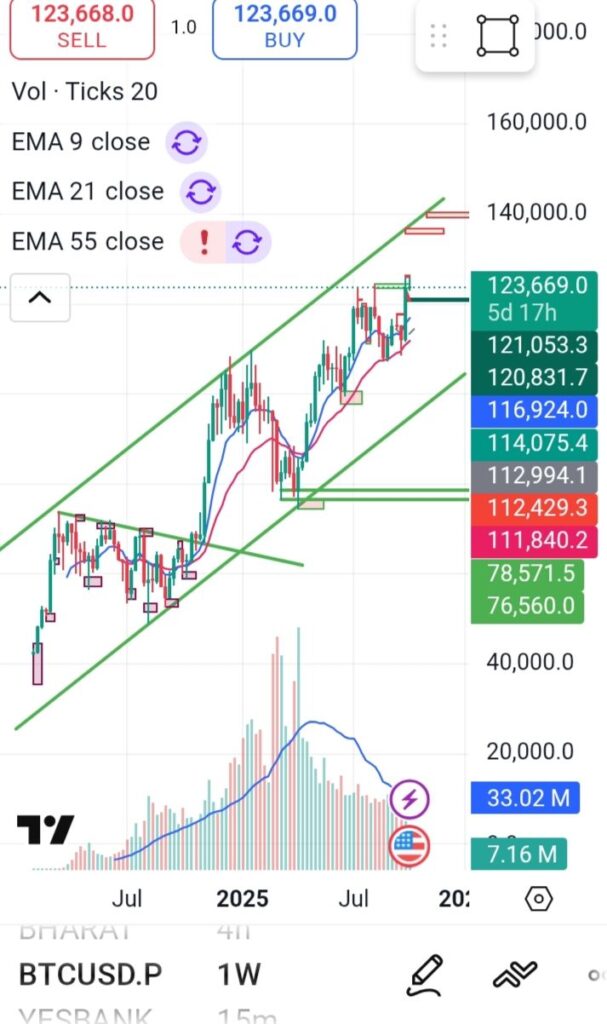
As you can see, the red box marks the resistance (or ceiling level), which is a potential zone to plan your Bitcoin sell trades. This is the key insight many traders miss!
I’m demonstrating this using the weekly chart, which I’ve found in my experience to be highly reliable—95% of the time, Bitcoin respects these levels.
Based on my trading journey, Bitcoin tends to form support and resistance levels while moving upward or downward, rather than during consolidation. So, always try to mark your support and resistance in trending moves (either uptrends or downtrends).
In the next chapter, I’ll show you how to synchronize support and resistance with other technical indicators. This will help you better predict the next direction of Bitcoin and improve your entry and exit points.
Thanks for reading!
Feel free to email me if you have any questions.
Now I’m off to sleep—thank you and good night! 😄